
Rigorous performance and load testing is a prerequisite for selecting any MPP analytics system. In this article I want to share the benchmarking approaches our team uses both in client engagements and in developing the Alphyn Lakehouse data platform, and to present the results of head-to-head engine comparisons. You will learn how to set the right goals, choose the right methodology, design test scenarios, record and interpret results — and most importantly, get an answer to the question: who wins, the hare Trino or the antelope Impala?
Selecting a target system, framework, or engine is the most obvious — and seemingly self-explanatory — reason to run a benchmark. Let's dig into what specifically needs to be validated and explored:
The system's intended use case and its role in the broader landscape. There are no universally "good" or "bad" systems. Some excel at concurrent BI access or complex ad hoc queries; others shine at sequential data transformation pipelines; still others handle the full range of modern data warehouse and data lake workloads equally well.
Identifying architectural characteristics. The goal isn't just to collect numbers — it's to understand: what level of expertise will end users and developers need? What functional limitations or quirks will they encounter? Which design patterns are favourable, and which should be avoided?
Gathering metrics to forecast the target system sizing.
When selecting a system or engine, it's important to understand how architectural differences affect the required hardware footprint. Different solutions have fundamentally different infrastructure and hardware requirements.
Test objectives drive requirements on methodology. I find it useful to approach methodology from the opposite direction: start by identifying the hallmarks of a bad benchmark.
Based on extensive experience implementing and benchmarking analytics systems and working with the vendors who build them, I've identified the following red flags in benchmark methodology:
Test dataset volume is several times smaller than total cluster RAM;
Queries are run sequentially: launch a query, write the result in a spreadsheet, move to the next one, repeat;
The same queries are re-run with identical parameters and without clearing the result cache or the filesystem cache between runs;
The physical data model is pre-tuned specifically for the agreed test queries (indexes, projections, sort orders matched to particular queries);
Only read operations are tested — SELECT without INSERT or CREATE.
These red flags should put you on guard. Is this a failure to understand what a real production analytics system actually demands, or a deliberate manipulation by the vendor or systems integrator?
Characteristics of a good benchmark:
Test dataset volume is several times larger than total cluster RAM. The ideal data-to-memory ratio is at least 5:1;
At least one iteration is performed without any physical data model optimisation targeting specific queries;
Tests run under concurrent load: multiple diverse queries launch simultaneously, or the same query runs in parallel with different predicates to eliminate cache hits. The cache itself is flushed before each iteration;
"Zerg Rush" — dozens or hundreds of heterogeneous queries arrive simultaneously or in waves over an extended period.
Why these requirements?
In real production, a system is always under significant load. It frequently processes dozens or even hundreds of queries simultaneously, and those aren't only DML statements — and certainly not only SELECTs. Statistics are often missing entirely, partially collected, or sampled (which is why I sometimes recommend running a separate additional iteration without statistics, or against a sparse, fragmented dataset that's been neglected). Running tests only under artificially optimised "hothouse" conditions that are rarely achievable in production gives you nothing useful.
A single running query typically does not saturate all hardware resources — and in a concurrent-access system, it shouldn't. The result of such a test only shows how the system behaves when one specific query runs in isolation. That's a functional validation at best, not a performance test.
You should start from the most adversarial scenario: no one has pre-built indexes, projections, materialised views, or sorted the data. Designing additional structures always incurs overhead in storage, write latency, and skills required. If the goal is to evaluate optimisation techniques, plan two separate iterations: one before physical model optimisation and one after, with mandatory recording of the overhead incurred. There is always a price for a performance gain on specific queries — write operations slow down, storage grows from additional structures, and so on.
Remember: the primary objective of benchmarking an analytics system is to measure throughput — the number of representative queries that a given system and hardware configuration can process per unit time, typically per hour.
Choosing a methodology
The methodology must reflect real client scenarios and data.
Option 1. Real client data at sufficient volume with a varied query set — the best possible starting point. The main problem is that clients often cannot provide data at the required volume, or lack the query diversity needed for meaningful test scenarios.
Option 2. An established open benchmark such as TPC-DS or TPC-H. Both are appropriate, but must be adapted to relevant scenarios. It's wrong to draw conclusions about a system by running all 99 TPC-DS queries sequentially and recording the results. TPC-DS was originally designed as a functional test of ANSI SQL compatibility — "does the query run without rewriting?" If the standard methodologies don't fit (for example, they don't match the business domain), you can develop a custom methodology. The key is that it meets the goals and criteria above.
Option 3. A combination of options 1 and 2, using the open benchmark to cover scenarios the client cannot currently provide from their own data.
Let's outline a plan for ideal benchmarking. The sequence of steps:
Generate a test dataset (in the absence of a representative production dataset) several times larger than total cluster RAM — ideally five times larger;
Run all baseline queries from the chosen methodology sequentially to confirm they execute correctly on the target system or engine. This step gates the creation of test scenarios;
Build concurrent-access scenarios using varied queries from the baseline set, grouped or all launched simultaneously. Queries that return large result sets must materialise the results wherever the result set is expected to exceed 1,000 rows;
Configure the system for optimal concurrent operation;
Measure scenario execution time and derive a "queries per hour" (or per other time unit) throughput metric;
Optionally enrich the methodology with analytical tasks or the construction of materialised data marts;
Compile a results report.
Throughout testing, record hardware resource utilisation. This data is essential for designing the target sizing. It's important to understand which resources the solution demands — every system and engine, due to architectural differences, has different hardware requirements. Without utilisation analysis it's impossible to conclude how efficiently and which resources are being consumed, what bottlenecks exist or may arise in the target solution, and most importantly: whether the system is configured for maximum throughput in the current test iteration or still has headroom. Without this knowledge you cannot project an appropriate target sizing. Correct sizing guarantees expected performance with room for growth and ensures optimal hardware and licensing costs — the latter often being a direct function of hardware metrics.
When assessing overall system performance from benchmark results, all nuances must be accounted for:
what concurrency management mechanisms are available (resource queues or groups, compute tenant partitioning within a shared cluster, etc.);
which query types and operators are favourable for the engine, and which may cause problems;
which compression algorithms were applied and what compression ratios they achieved relative to raw data (this also affects sizing and total cost of ownership calculations).
When running subsequent iterations with physical model optimisations, don't forget to record in the report the disk footprint of the optimised structures and their impact on write throughput.
Comparing results
If the same hardware is dedicated to all systems under test, comparing results is straightforward — raw numbers, nothing more. But what if the systems were tested on different hardware, or their architectural approaches are so different that they required different hardware types and topologies? Or if tests were run in a cloud environment? In these cases, the right approach is to introduce a cost-of-compute metric: the monetary cost of executing a scenario (or completing the full test run). In the cloud this is trivial — use billing data or the cost calculator each provider offers. Cloud billing captures all costs that may not be obvious at first glance, which makes it the most accurate and honest basis for comparison.
In an on-premises environment this calculation is only possible if you know the purchase and operational cost of the hardware, or of a discrete compute unit (private cloud infrastructure often introduces such a metric for allocating costs to internal consumers).
Trino vs Impala: Comparative Performance Benchmark
With the theory covered, let's move to the results. The Alphyn Lakehouse platform includes two SQL processing engines: Impala and Trino. Two questions I'm regularly asked in client conversations are "why do you have two engines?" and "which one is faster?" I addressed the first question in a previous article, so let's focus on the second. Here are the results of our internal benchmarking.
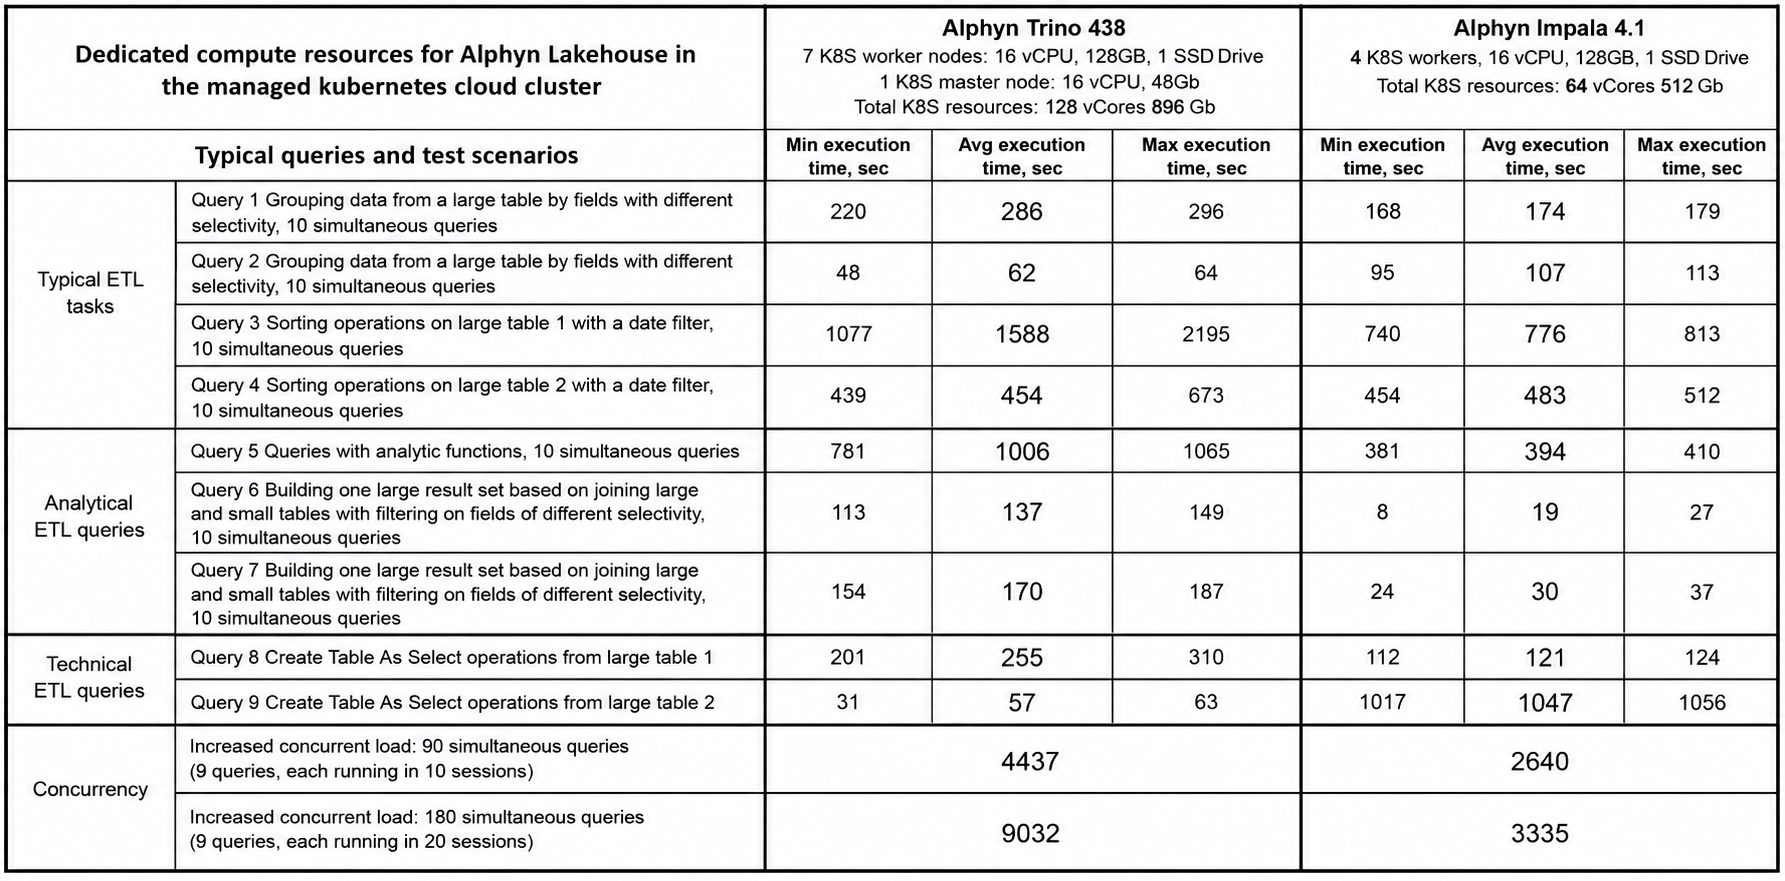
Test environment description:
Cloud environment with managed Kubernetes and managed S3;
Engines run on identical K8S worker nodes with identical parameters;
Data loaded into managed S3;
Both engines tuned for maximum throughput (resource queues, parameter tuning for maximum resource utilisation, configurable parallelism per scenario, query plan inspection, etc.);
Fault-tolerance mode was disabled for Trino to reduce its S3 communication overhead.
Methodology:
Synthetic dataset of approximately 16 TB from a banking domain, snowflake schema;
Representative queries covering a variety of tasks typical of data exploration and the construction of analytical layers and data marts;
Queries returning large result sets materialise the output;
All queries run at concurrency 10, with predicates chosen so that each query in a group reads a distinct range (to eliminate caching effects);
Scenarios are executed with JMeter, which records maximum, minimum, and average execution times within each group;
A separate scenario runs all queries from all groups at 10 and 20 concurrent sessions each, producing a combined load of 90 and 180 simultaneous queries respectively.
This methodology was developed jointly by one of our clients and a vendor approximately eight years ago and has proven itself well for validating analytical data warehouse use cases. The methodology is available on request.
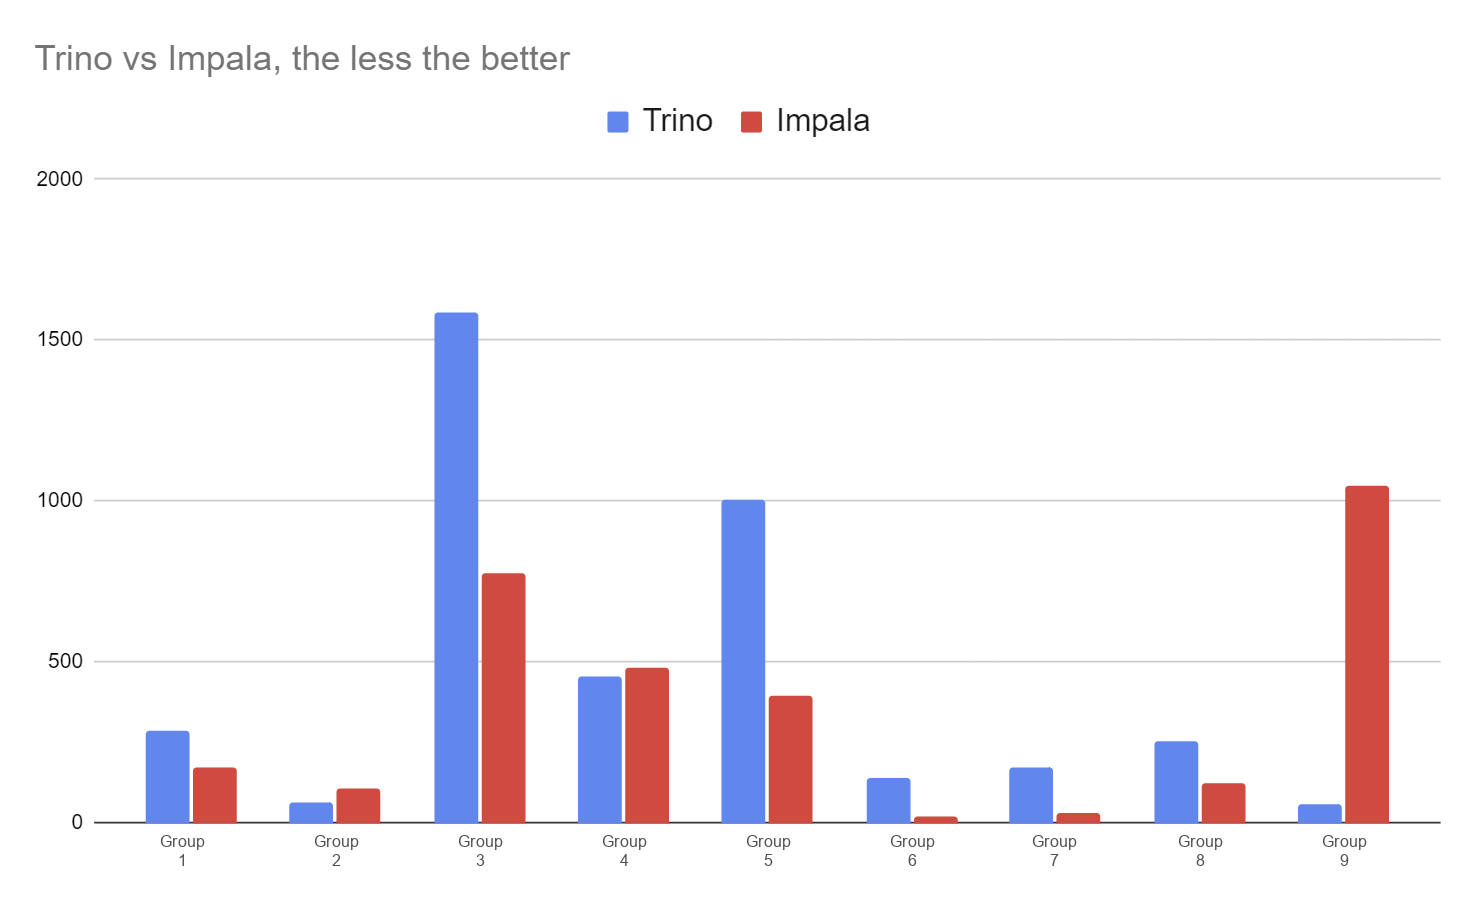
One outlier that stands out in the overall picture is query 9, which warrants separate attention. After a detailed review of query profiles, we concluded that in this query Impala — having initially narrowed the scan range via min/max filtering at the Parquet file, row group, and page levels — performs twice as many reads as Trino at the page index filtering stage, even though Trino applies the same min/max page-level filtering. We are currently investigating the root cause in debug mode and expect to address it.
Let's translate the results into throughput and cost-efficiency metrics. For this comparison we use the 90- and 180-concurrent-query scenarios.
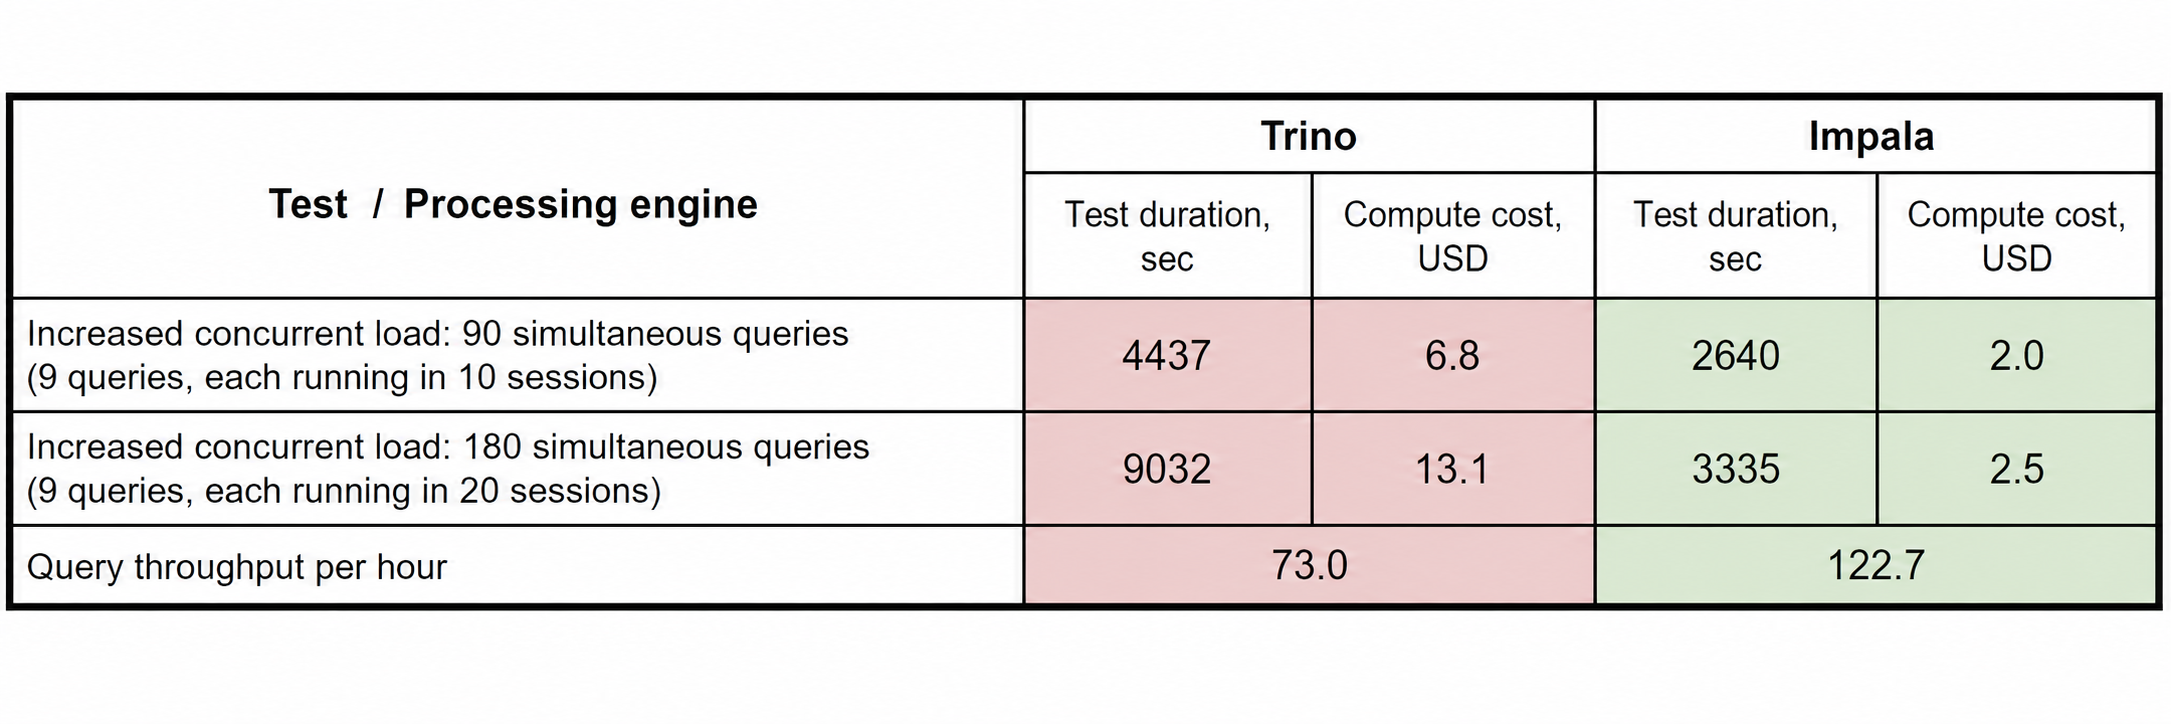
Configuration cost was calculated using the cloud provider's billing calculator. In this particular comparison, the monetary metric is more honest and informative than raw throughput, since we used different types and quantities of K8S worker nodes. Throughput alone is only meaningful for a specific engine on a specific configuration.
Below is a similar test run in a client on-premises environment, where both engines competed on equal hardware. The test dataset was doubled to 32 TB, and MinIO was used as the S3-compatible object store. More details about the environment are covered in a recorded talk (which also covers MinIO and its performance metrics in depth). Newer engine versions were used relative to the cloud test above.
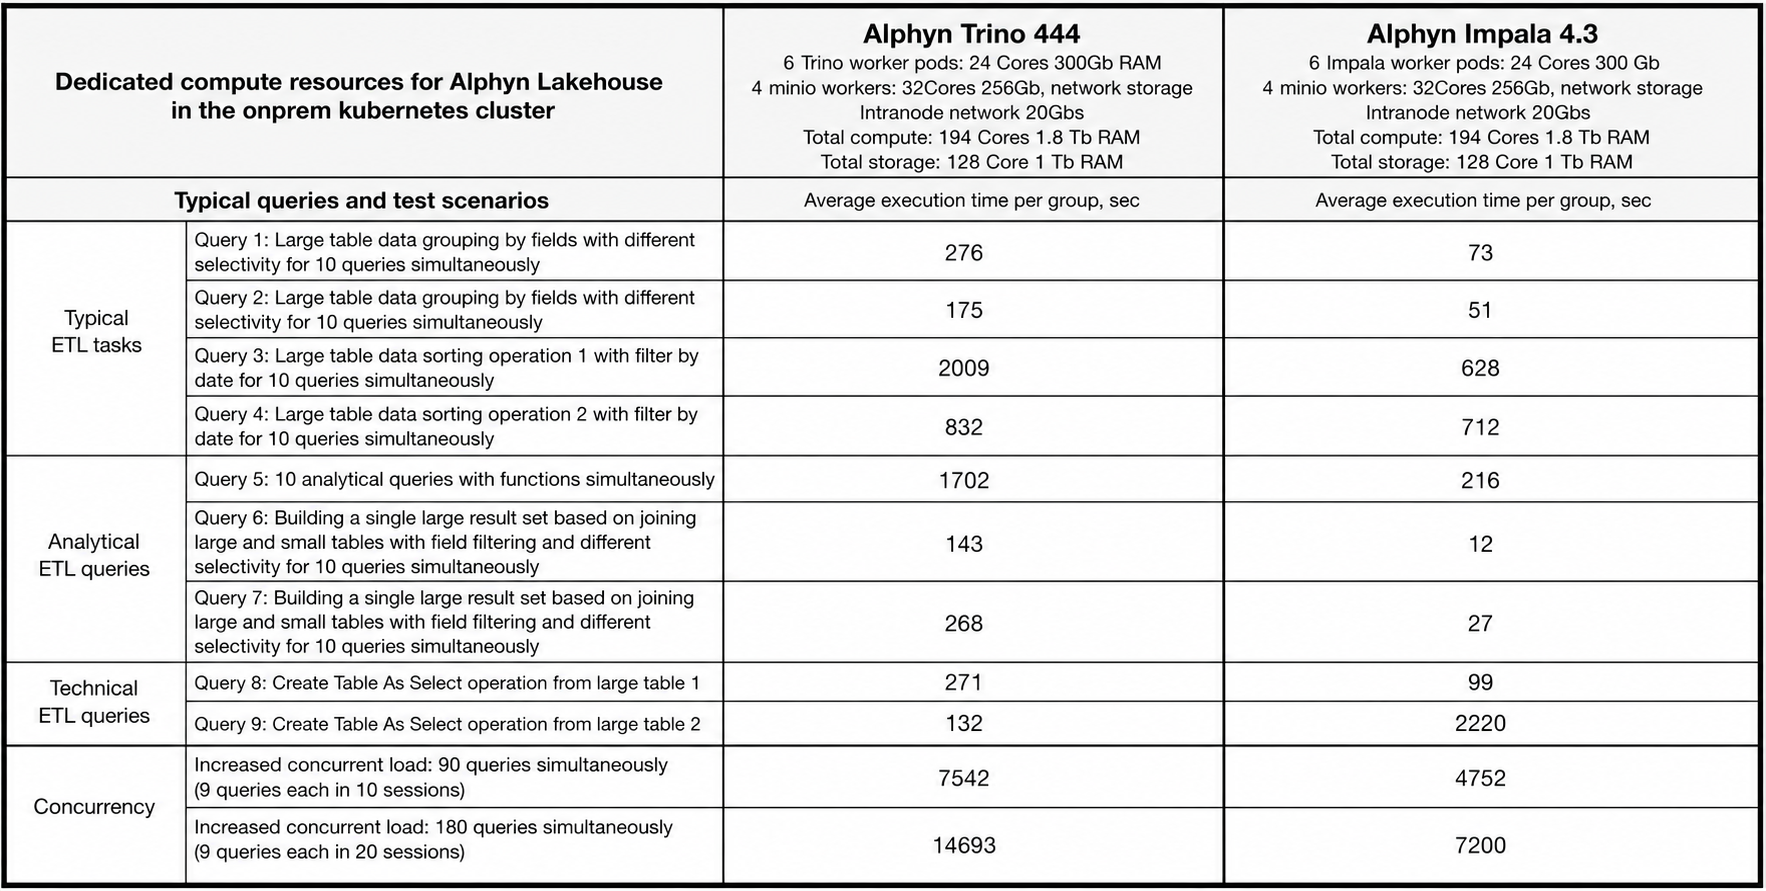
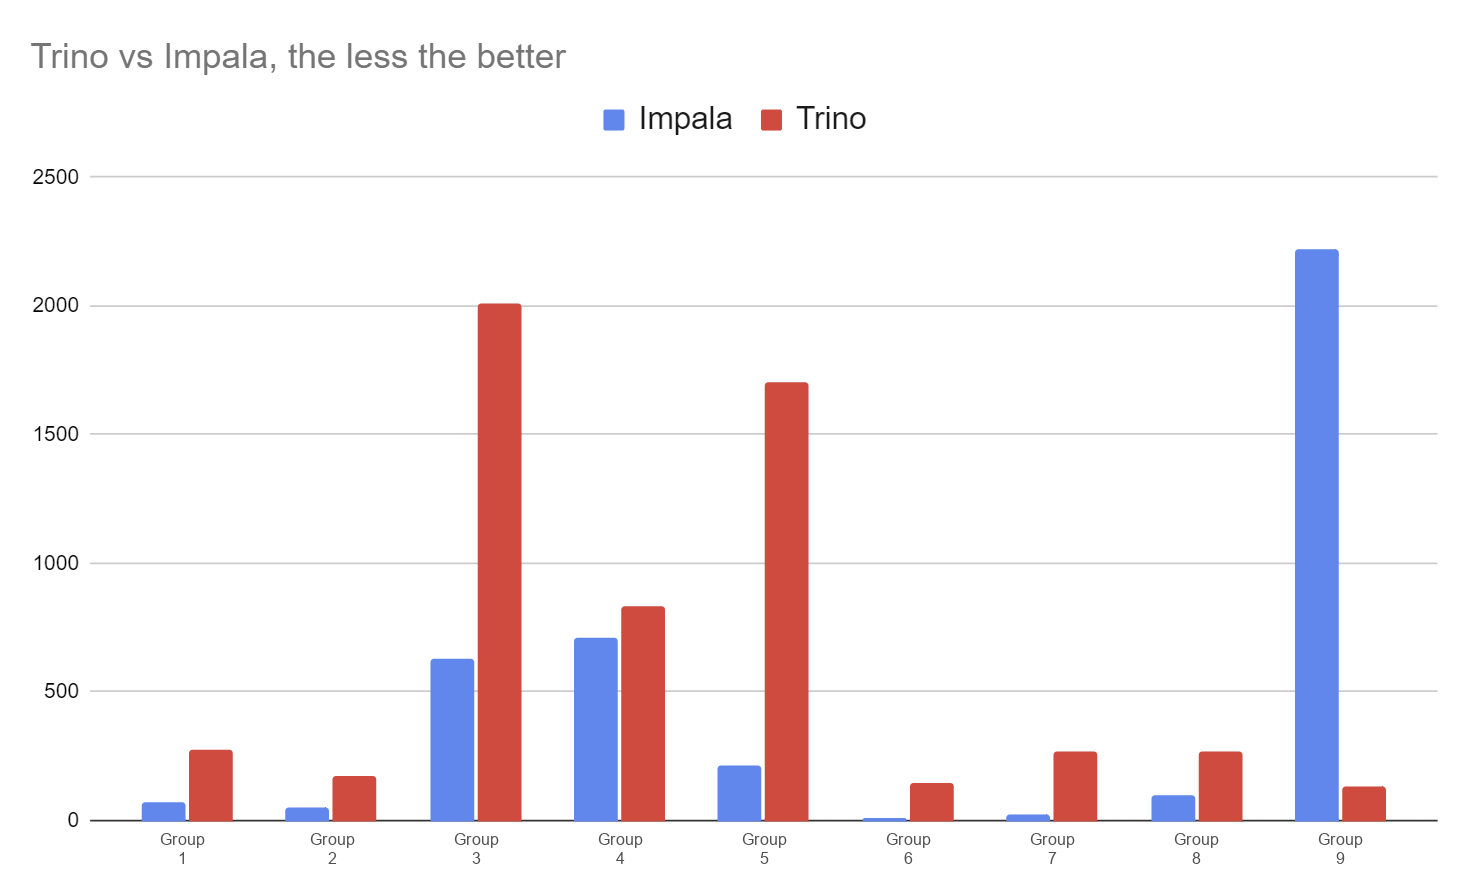
In the majority of scenarios, Impala delivers better performance and throughput. Could this be an artefact of the methodology, the queries, or the data?
Fair question — but what if we tested against a real workload in a production environment? Here's what we found.
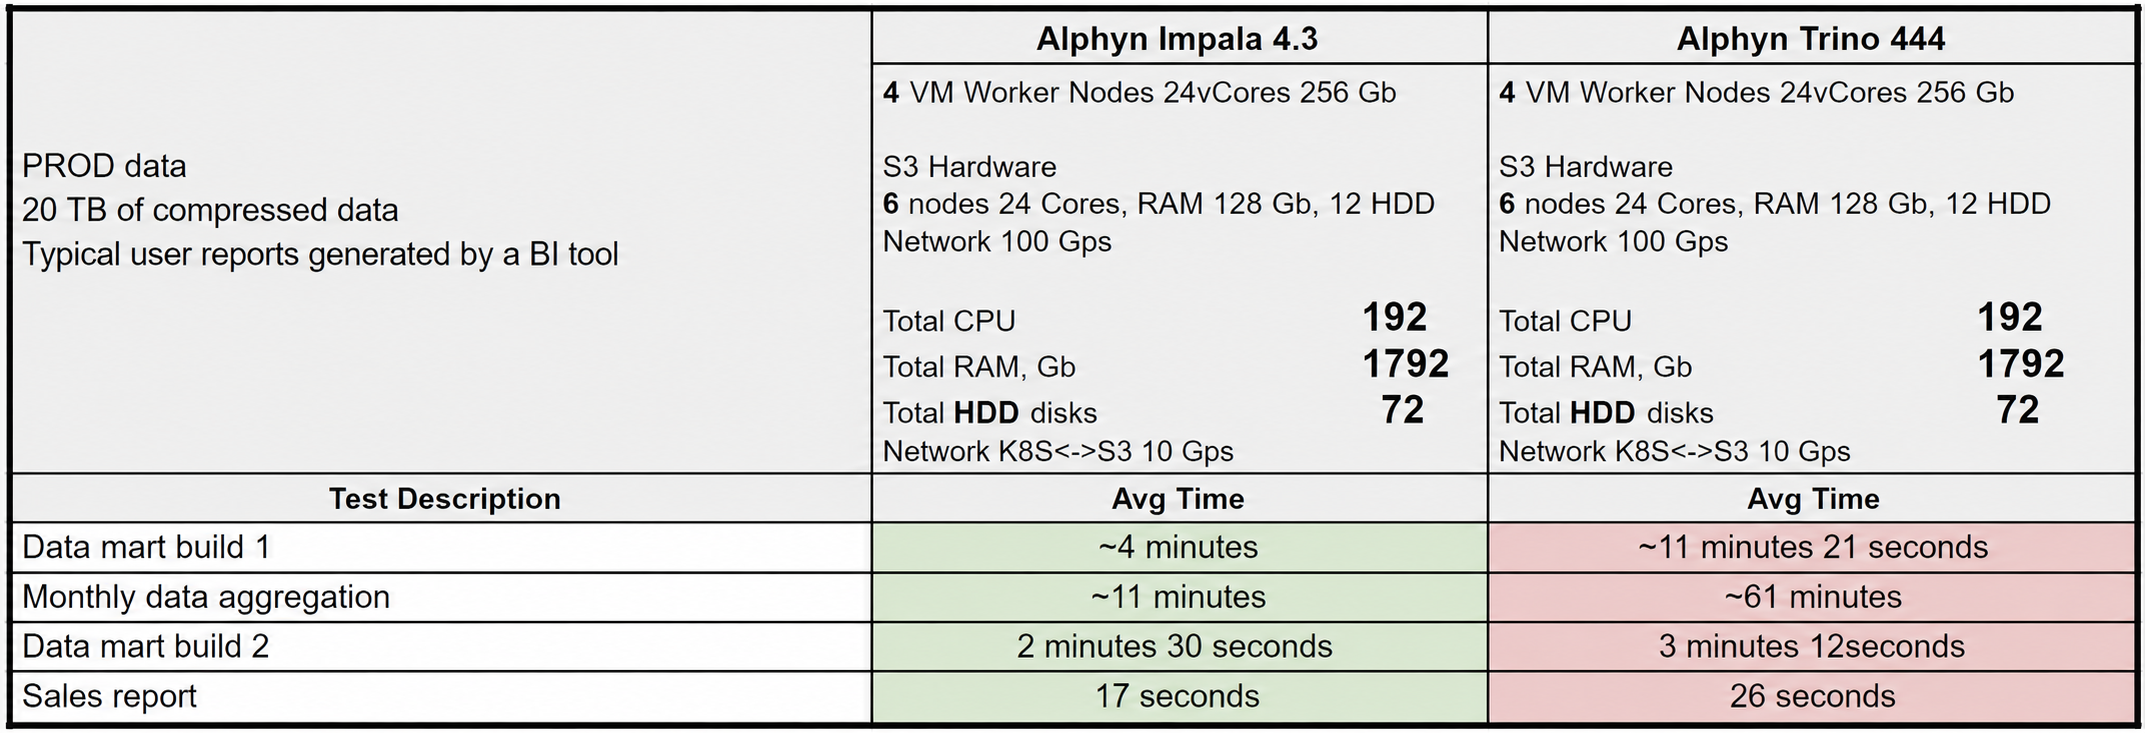
This test was run in a client's private-cloud infrastructure using real production data. All queries were generated by a BI tool, so per the test conditions they were run without any modification (no hints or plan rewrites allowed). Data was stored in the engine-friendly Iceberg Parquet format with Zstd compression level 3. Both engines were configured for maximum performance (optimal intra-node parallelism, maximum utilisation of allocated compute cluster resources). Fault-tolerance mode was disabled for Trino (a configuration that favours its performance).
Our experience running and benchmarking both engines in real production shows that for high-concurrency workloads where maximum resource utilisation is required, Impala outperforms Trino — the antelope overtakes the hare. The reasons come down to Trino's architecture:
Higher overhead as a Java application running on the JVM. On the same node, Impala operates stably with 90% of available RAM allocated, while Trino must either be given a tighter concurrency cap through queuing, or have its memory allocation cut to as low as 70%, in order to achieve stable operation — both of which hurt throughput;
Higher memory consumption per query compared to Impala, which only becomes a liability under concurrent load;
Largely declarative resource management — it exists formally and generally works, but under heavy load it can breach both its own resource group settings and the JVM limits of the environment it runs in.
None of this changes the fact that Trino is a solid, modern, high-performance SQL processing engine — one that also supports federated query access across many sources (Impala's federated capabilities are still nascent and support only a limited set of sources). This is why Trino is included in Alphyn Lakehouse, and our team actively contributes improvements to it, particularly around security and performance.
Yes, Impala is currently faster — but we are working on native execution for Trino to close the gap with Impala, and on Impala itself, replacing its legacy Java Hadoop S3 interaction layer with our own C++ implementation. Stay tuned for updates.
Trino and Impala vs Greenplum
Now let's bring in another widely used solution — Greenplum — and look at the full benchmark with all three participants.
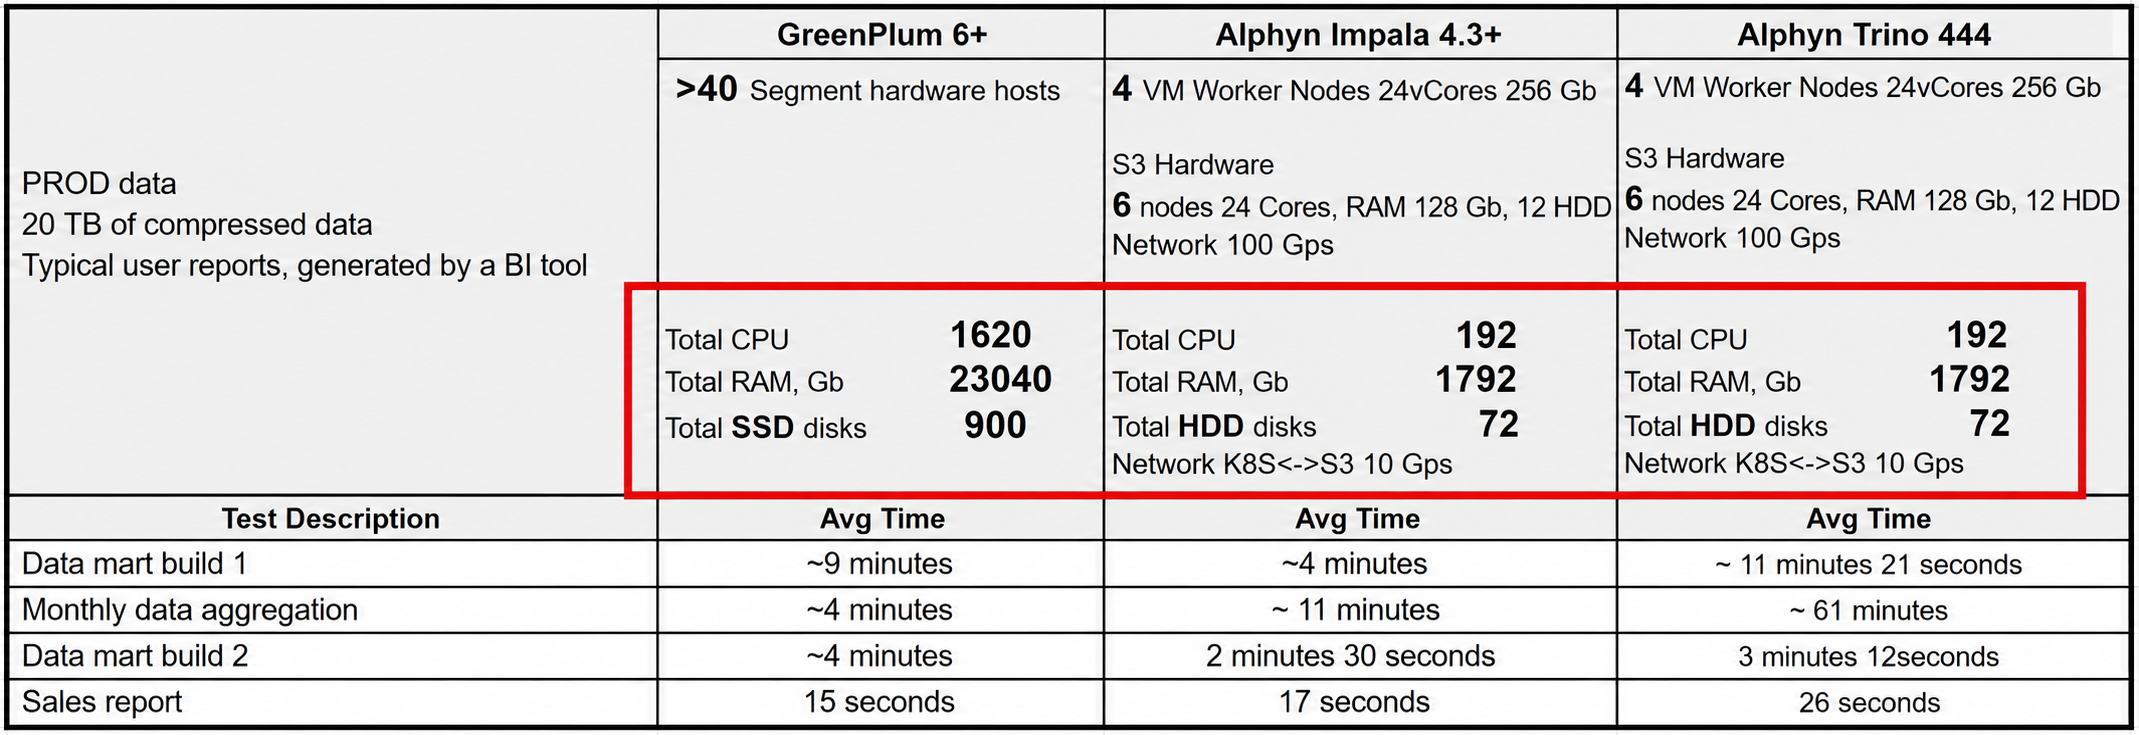
Alphyn Lakehouse — running on either Trino or Impala in a private-cloud virtual infrastructure — delivers performance comparable to Greenplum, which has an order of magnitude more hardware: over 40 bare-metal segment servers with a combined disk subsystem of 900 SSDs, 100 Gbps network interconnects, and RAM capacity on par with the entire dataset. The Greenplum deployment is of course optimised for maximum performance (uniform distribution keys, co-located joins, partitioning, appropriate per-query memory settings, no spills, resource queues, and every other available technique), since it runs in active production. The Greenplum measurement was taken during regular daily ETL load, under which the computation of the data marts included in the test consumed 80% of cluster resources.
Yet the comparison clearly demonstrates how far the legacy MPP architecture has fallen behind. Systems like Greenplum that rely on full-scan operations and lack modern optimisation techniques — dynamic Bloom filtering, two-level storage index filtering — make extremely poor use of their hardware and lose decisively to modern architectures and processing engines. Greenplum's performance-per-dollar ratio relative to a SQL MPP Lakehouse is simply not competitive.
What's next
The results presented here may differ from your own experience or expectations. If you disagree with the findings and observations, we welcome the challenge — let's dig into it together. The best benchmark is the one you run yourself with the help of qualified experts. The key is choosing the right experts.
What we plan to publish and demonstrate in the near term:
TPC-DS results in classic sequential mode;
TPC-DS augmented with concurrent load scenarios and ETL pipeline scenarios, including bulk DDL operations (which also make for a good metadata catalog stress test);
Fast data mart access benchmarks — tens to hundreds of queries per second against a materialised mart, with key-based and multi-predicate lookups;
Performance results for the third SQL MPP processing engine currently in preview in Alphyn Lakehouse, benchmarked against Trino and Impala;
Ongoing performance improvements to both Trino and Impala, with results shared as we go.
Our principles:
Only validated solutions reach clients;
Product roadmap must be driven by hands-on experience and experiments grounded in real-world conditions — not GitHub star counts, Telegram channel follower numbers, or third-hand material from the internet.
See it on your own data
If you're weighing how this would handle your workloads, we'd be glad to walk you through Alphyn Lakehouse on a real scenario. Book a sovereign-lakehouse walkthrough →
About Alphyn.AI
We build the Alphyn Lakehouse, a Kubernetes-native, high-performance, multi-engine lakehouse for any enterprise data and analytical workload — from agentic AI and BI to structured and unstructured data. Built entirely on open standards and an open architecture, Alphyn Lakehouse is a sovereign, on-premises solution for regulated enterprises across the GCC and the wider MENA region.